

8,000 schools use Gynzy
92,000 teachers use Gynzy
1,600,000 students use Gynzy
General
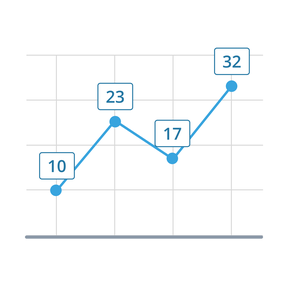
Create your own line chart by adding data to a table or generating a random one. You’ll have the option to create a line chart with one or two lines.
Settings
In the Settings menu, you’ll be able to choose between a line chart with a single line or multiple lines. A “single line” chart creates a chart with up to 10 points that are connected by a line. A “multiple line” chart creates a chart with 2 different colored lines (2 data sets) that can be compared.
You can also choose how you want to display the values on your line chart. “Reveal values on click” hides the values in the chart. You can click on the points to reveal their value. Alternatively, you can choose to always show the values of the points in the chart.
The online teaching platform for interactive whiteboards and displays in schools
Save time building lessons
Manage the classroom more efficiently
Increase student engagement
About Gynzy
Gynzy is an online teaching platform for interactive whiteboards and displays in schools.
With a focus on elementary education, Gynzy’s Whiteboard, digital tools, and activities make it easy for teachers to save time building lessons, increase student engagement, and make classroom management more efficient.
