

8,000 schools use Gynzy
92,000 teachers use Gynzy
1,600,000 students use Gynzy
General
Students will learn to collect data and draw a scaled picture graph. They will learn the parts of the graph. They will read several picture graphs and answer the questions about them.
Standards
CCSS.Math.Content.3.MD.B.3
Learning objective
Students will be able to draw a scaled picture graph.
Introduction
Students begin by viewing a disorganized work area. They brainstorm on how they can improve it. This leads to the concept that numbers (data) are more easily understood when they are organized on a graph.
Instruction
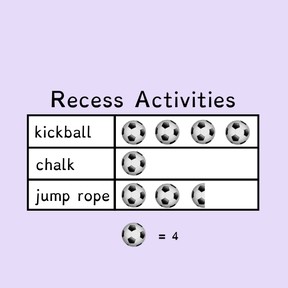
To begin, students are taught what data is. They learn that you can design a survey to collect data. They review the use of tally marks to count votes and practice counting tallies. With the results of a mock survey on Recess Activities, students are encouraged to think about the best scale for the data. With the scale, they add the symbols to the graph. They also see the graph with a different scale that uses half a symbol and discuss why this is needed. Another practice allows the students to drag the parts of the graph to complete it. This is followed by the ten-question quiz.
Quiz
Students respond to ten multiple-choice and true/false questions.
Closing
Students will complete the steps to make their own picture graph. They will make a short survey and collect data. They will draw a graph with a title, labels, symbols, and a scale.
Instruction materials
- paper
- pencils
- rulers (optional)
- markers or crayons
The online teaching platform for interactive whiteboards and displays in schools
Save time building lessons
Manage the classroom more efficiently
Increase student engagement
Discover more!
About Gynzy
Gynzy is an online teaching platform for interactive whiteboards and displays in schools.
With a focus on elementary education, Gynzy’s Whiteboard, digital tools, and activities make it easy for teachers to save time building lessons, increase student engagement, and make classroom management more efficient.


